All published articles of this journal are available on ScienceDirect.

Obesity Increases the Prevalence of Astigmatism in Children and Adolescents
Authors Info & Affiliations
Abstract
Introduction
Obesity is currently the most common form of malnutrition in most regions of the world. Refractive error is a major public health concern worldwide, with astigmatism being the most common type of refractive error. However, it is still unclear whether nutritional status is related to astigmatism in children and adolescents.
Methods
A cross-sectional study was performed in 2023, and a stratified cluster sampling technique was employed among school-aged students in Nantong City, China. A total of 9,458 participants were enrolled in the study. Univariate and multivariate logistic regression analyses were carried out to investigate specific correlations between astigmatism and related parameters. Various types of nutritional status were also considered in the study.
Results
The prevalence of astigmatism among Chinese school-aged children and adolescents was 28.5%, and the overall prevalence of obesity was 11.8%. Multiple logistic regression analyses showed that nutritional status, refractive state, axis position, and age were significantly associated with astigmatism (all, p < 0.001). Among them, participants with obesity were 2.01 times more likely to suffer from astigmatism (aOR: 2.01, 95% CI: 1.74–2.31, p < 0.001). However, nutritional status was not significantly associated with myopia (p > 0.05).
Discussion
Obesity elevates astigmatism risk in children, likely through periorbital fat increasing eyelid pressure on the cornea—supported by the predominance of with-the-rule astigmatism (85.6%). The cross-sectional design limits causal inference, and corneal topography was not analyzed. Public health initiatives targeting childhood obesity may mitigate astigmatism burden, though longitudinal studies are needed to confirm mechanisms.
Conclusion
The findings of this study have identified the relationship between nutritional status and astigmatism in children and adolescents. It is necessary to strive to maintain a normal nutritional status in children and adolescents in order to reduce the risk of astigmatism.
1. INTRODUCTION
Globally, obesity has emerged as the predominant form of malnutrition, with over 160 million children and adolescents affected as of 2022 [1]. Concurrently, refractive errors, particularly astigmatism, remain a leading cause of preventable visual impairment, contributing to academic challenges and long-term ocular morbidity in pediatric populations [2-4]. While genetic predisposition and environmental factors are well-recognized contributors to astigmatism, emerging hypotheses suggest that nutritional status may influence ocular biomechanics, such as eyelid tension and corneal curvature [5, 6]. For instance, obesity-related anatomical changes, including periorbital fat accumulation and altered eyelid pressure, could mechanically exacerbate corneal distortion [7-9]. However, existing studies predominantly focus on myopia-nutrition linkages, leaving the relationship between obesity and astigmatism in children underexplored [10, 11].
Prior research in China highlights rising pediatric obesity rates and their systemic health impacts [12, 13], yet ocular implications remain poorly characterized. Notably, our team’s earlier work using the Nantong School-aged Children Eye Study (NSES) database identified risk factors for anisometropia, dry eye, and scoliosis [14-16], but astigmatism-nutrition interactions were unaddressed. Mechanistically, Grosvenor’s theory posits that eyelid pressure shapes corneal astigmatism [7], a process potentially amplified by obesity-induced orbital changes [17, 18]. Despite this plausibility, large-scale epidemiological evidence is lacking, particularly in rapidly developing regions like eastern China, where lifestyle shifts may compound risks [13].
This study leverages the NSES dataset to examine the association between nutritional status (obesity, overweight, and malnutrition) and astigmatism in 9,458 school-aged children. By integrating anthropometric and refractive data, we aim to clarify whether obesity independently elevates astigmatism risk, addressing a critical gap in public health strategies to mitigate visual impairment in this vulnerable population.
2. METHODS
2.1. Participants
The present study is part of the Nantong School-aged Children Eye Study (NSES), which has been registered in the Chinese Clinical Trial Registry (http://www.chictr.org. cn, ChiCTR2300077367). The NSES is a school-based study of eye conditions in Nantong, a medium-sized prefecture-level city in eastern China with a relatively stable population profile. In September 2023, a cross-sectional study was conducted. The study was approved by the ethics committee of the Second Affiliated Hospital of Nantong University, China (no. 2023KT122). All methods were carried out in accordance with the Declaration of Helsinki [19]. Informed consent was obtained from parents and participants, and verbal permission was obtained from all participants before examinations.
A school-based study conducted in Huantai, Shandong, reported that the prevalence of astigmatism was 27.9% in 2020 [20]. To achieve a power of 80%, the sample size was calculated using the following formula [13, 21]: n =t2pq/d2, assuming a design effect of 1.5 due to cluster sampling and a nonresponse percentage of 5% [t = 2 for a 95% confidence interval (CI), q = 1–P, d = 0.1 P]. The total sample size was at least 1,034. To ensure better multifactor analyses, more samples were included in the protocol. A stratified cluster sampling method was used. This study included primary, junior high school, and senior high school students from 30 primary and secondary schools (10 primary schools, 10 middle schools, and 10 high schools) in the urban areas and towns of Nantong City, China. The cluster was stratified by grade and age. Classes in each grade were selected by simple random sampling, and all students in these classes were required to participate in the study. At least two classes were randomly selected from each grade of each school to ensure that no less than 80 students were selected each time. This sample size was sufficient to detect risk factors using multivariate analysis. The inspection site was set in each school. Before the study began, researchers visited and arranged each venue to standardize the lighting and test distances. Autorefractors were calibrated every day.
The exclusion criteria were: (1) systemic diseases that may significantly affect body mass index (BMI), such as hepatitis, nephritis, anemia, diabetes, etc.; (2) participants with ptosis, tropia, pterygium, keratitis, glaucoma, cataracts, lens dislocations, uveitis, fundus diseases, previous ocular surgery or injury, or a history of orthokeratology or contact lenses. Participants with deficient data were also excluded from the statistical analysis. The inspection site was set in each school. The percentage of children who volunteered to participate in the invitation was 98.5%.
2.2. Ophthalmic Examinations
An experienced clinical team comprising five optometrists and five ophthalmologists from the Second Affiliated Hospital of Nantong University performed all examinations. Optometrists conducted non-cycloplegic autorefraction, UCVA, and BCVA measurements, while ophthalmologists screened for ocular pathologies (e.g., ptosis, keratitis, cataracts) and validated refractive results in cases of discrepancies. Participants suspected of ocular abnormalities were referred for further clinical evaluation. Demographic data were collected before examinations, including age, sex, and school locations in cities or towns. The study referred to previous research and considered that astigmatism correction needed in daily life was related to the status of natural pupil sizes [22]. Astigmatism was represented by non-cycloplegic values. All participants received standardized ophthalmic examinations, and non-cycloplegic refraction was measured using three repeated measurements using a closed-field autorefractor (WSRMK-8000; Biobase, Shandong, China), which minimizes accommodative responses by allowing binocular viewing during measurement, thereby enhancing reliability in pediatric populations [23]. If any two of the measurements were greater than 0.50 D (diopters), additional checks were conducted. Vision measurement used a standard logarithmic liquid crystal tumbling E chart (WSVC-100; Qingdao Optometry, Berkeley, CA, USA) at 5 m, starting with the right eye. The average value of three measurements was then analyzed. The best-corrected visual acuity (BCVA) was corrected according to the autorefractor results. Refinements of the sphere, cylinder, and axis were conducted to achieve the BCVA. Subjective refraction values (post-refinement) were used to define astigmatism (cylinder ≥1.00 D) and categorize axis positions (WTR, ATR, and OBL).
2.3. Anthropometry
Conventional physical examinations, including weight, height, and blood pressure, were conducted by well-trained health workers. The World Health Organization has described a measurement scheme for height and weight [24]. The weight parameter was measured using a beam scale to the nearest 0.1 kg, without wearing thick clothes while wearing minimum clothing and keeping the body steady. The height parameter was precise to 0.1 cm without shoes, with the back to the column and the torso naturally straight, the head upright, and the eyes looking straight ahead. BMI was then calculated as weight (kg)/height (m)2.
2.4. Definitions
Astigmatism is defined as a cylinder ≥1.00 D in absolute value, consistent with thresholds used in global pediatric refractive error studies to ensure comparability [25, 26]. This cutoff is clinically significant, as uncorrected astigmatism ≥1.00 D may impair visual development and academic performance in children [27]. Participants with a cylindrical refractive error of <1.0 D in absolute value were included in the non-astigmatism group. For all participants (including the non-astigmatism group), the cylindrical axis was recorded to analyze astigmatic orientation, even if the magnitude did not meet the clinical threshold for astigmatism. This approach allowed comprehensive characterization of corneal curvature patterns across the population. According to the axis position, WTR was a negative cylinder axis falling between 1° and 30° or 150° and 180°, and ATR was a negative cylinder axis falling between 60° and 120° and oblique (OBL) in other orientations. Spherical equivalent (SE) was calculated as follows: SE = cylindrical degree × 0.5 + spherical degree. Myopia was defined as SE ≤ −0.5 D. Emmetropia was defined as −0.5 D < SE ≤ 0.5 D. Hyperopia was defined as an SE > +0.5 D.
Based on the age, sex, height, and BMI of the participants, reference was made to the Chinese School Age Children and Adolescents Malnutrition Screening Standards (WS/T456-2014) [28], the Chinese School Age Children and Adolescents Overweight and Obesity Screening Weight Index Classification Standards (WS/T 586-2018) [29], and the Adult Weight Determination Standards (WS/T 428-2013) [30]. According to these relevant standards, the cut-offs included “obesity”, “overweight”, “normal”, “delayed growth”, “mild emaciation”, and “moderate and severe emaciation”. “Delayed growth”, “mild emaciation”, and “moderate to severe emaciation” were collectively referred to as “mal-nutrition.”
2.5. Statistics
Clinical examination forms were verified at least twice to evaluate integrity and precision before being entered into the database. Data were analyzed using SPSS statistical software for Windows, version 22 (SPSS, Chicago, IL, USA), with the significance level set at p < 0.05. All statistical tests were two-sided. The SE values and cylindrical values in the right and left eyes were highly correlated using Pearson’s correlation analysis (r = 0.894, p < 0.0001) (r = 0.814, p < 0.0001). Therefore, the right eye was used for analysis in this study. Means ± standard deviation, frequencies, and percentages were used to summarize the characteristics of the research subjects. According to the situation, the chi-square test or independent t-test was used to compare differences between groups regarding astigmatism and nutritional status, as well as other related parameters. The polynomial linear correlation in one-way analysis of variance was used for the trend test (Ptrend). To estimate the relationship between nutritional status and astigmatism, univariate and multivariate logistic regression models were constructed to determine the relationship between nutritional status and the prevalence of astigmatism. The odds ratio (OR) and 95% confidence interval (CI) for the associated factors were calculated, and values of multivariate logistic regression analyses were expressed as adjusted OR (aOR). All variables for multivariate logistic regression analysis were examined for multicollinearity, with the variance inflation factors for all variables being <5. The multivariable logistic regression model was established by forward stepwise selection. The Hosmer-Lemeshow test showed p > 0.05 (x2 = 11.34, p = 0.183). Similarly, univariate and multivariate logistic regression models were constructed to determine the relationship between nutritional status and the prevalence of myopia. The model was adjusted for age, sex, systolic pressure, and diastolic pressure. Three multivariate logistic regression models were constructed to determine the relationships between the axial position of the cylindrical lens (WTR, ATR, and OBL) and nutritional status. The models were adjusted for age, sex, refractive state, systolic pressure, and diastolic pressure.
3. RESULTS
3.1. Characteristics of Participants
A total of 9,864 students in these classes selected by the stratified cluster sampling method were invited to participate in the study. The completion percentage of students out of all schools was 6.5%. Of the 9,864 students invited, 9,458 (95.9%) met the inclusion criteria and were finally recruited for the statistical analysis. Exclusions (n=406,4.1%) were due to systemic/ocular comorbidities (n=150), non-cooperation or absence (n=86), or incomplete data (n=170). Of 9,458 students, 53.2% (n = 5,034) were males, and 46.8% (n = 4,424) were females. The mean age was 13.33 ± 3.50 years, ranging from 7–20 years. The overall prevalence of obesity was 11.8%, the prevalence of overweight was 11.4%, and the prevalence of malnutrition was 11.4%. The mean cylinder refraction in the right eye was −0.73 ± 0.74 D, while the mean spherical refraction in the right eye was −1.92 ± 2.26 D. The overall prevalence of astigmatism was 28.5%, and 2.0% of the participants had cylinder refractions less than −3.00 D.
As mentioned in Table 1, astigmatism was more prevalent in males (30.7%) than in females (26.0%) (x2: 25.24, p < 0.001). As presented in Table 1 and Fig. (1), the percentages of astigmatism and non-astigmatism in different nutritional status of children and adolescents were significantly different (x2: 166.65, p < 0.001). The prevalence of astigmatism in the malnutrition, normal, overweight, and obesity groups was 21.1%, 25.7%, 35.3%, and 40.7%, respectively. The distribution of the axial position of the cylindrical lens was significantly different between the astigmatism and non-astigmatism groups (x2: 353.10, p < 0.001). As shown in Fig. (2), in the astigmatism group (cylinder ≥1.0 D), WTR, ATR, and OBL accounted for 96.3%, 2.3%, and 1.4%, respectively. In the non-astigmatism group (cylinder <1.0 D), WTR, ATR, and OBL accounted for 81.4%, 9.1%, and 9.5%, respectively. As shown in Fig. (3), in the WTR group, astigmatism and non-astigmatism accounted for 32.1% and 67.9%, respectively. In the ATR group, astigmatism and non-astigmatism accounted for 9.0% and 91%, respectively. In the OBL group, astigmatism and non-astigmatism accounted for 5.6% and 94.4%, respectively. As shown in Table 1 and Fig. (4), the percentages of astigmatism and non-astigmatism in different refractive states of children and adolescents were significantly different (x2: 313.74, p < 0.001). In the myopia group, astigmatism and non-astigmatism accounted for 33.1% and 66.9%, respectively. In the hyperopia group, astigmatism and non-astigmatism accounted for 24.9% and 75.1%, respectively. In the emmetropia group, astigmatism and non-astigmatism accounted for 12.6% and 87.4%, respectively. As reported in Table 1, astigmatism was related to age, systolic blood pressure, and diastolic blood pressure (all, p < 0.001).
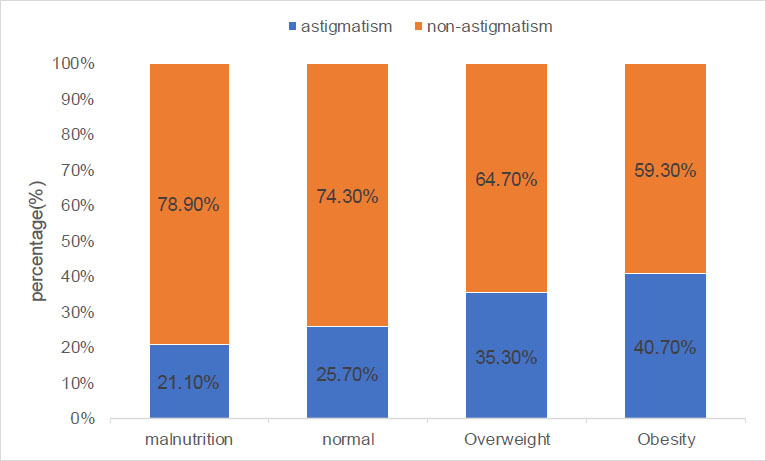
The percentages of astigmatism and non-astigmatism in different nutritional status of children and adolescents.
| Characteristic |
Total (n = 9,458) |
Non-astigmatism (n = 6,762) |
Astigmatism (n = 2,696) |
p-value |
|---|---|---|---|---|
| Sex, n (%) | - | - | - | 0.000 |
| Male | 5034 (100%) | 3489 (69.3%) | 1545 (30.7%) | - |
| Female | 4424 (100%) | 3273 (74.0%) | 1151 (26.0%) | - |
| Nutritional status, (%) | - | - | - | 0.000 |
| Normal | 5765 (100%) | 4281(74.3%) | 1484 (25.7%) | - |
| Malnutrition | 1079 (100%) | 851 (78.9%) | 228 (21.1%) | - |
| Overweight | 1497 (100%) | 968 (64.7%) | 529 (35.3%) | - |
| Obesity | 1117 (100%) | 662 (59.3%) | 455 (40.7%) | - |
| Axis position, n (%) | - | - | - | 0.000 |
| Oblique | 682 (100%) | 644 (94.4%) | 38 (5.6%) | - |
| With-the-rule | 8098 (100%) | 5501 (67.9%) | 2597 (32.1%) | - |
| Against-the-rule | 678 (100%) | 617 (91.0%) | 61 (9.0%) | - |
| Refractive state, n (%) | - | - | - | 0.000 |
| Emmetropia | 1916 (100%) | 1675 (87.4%) | 241 (12.6%) | - |
| Hyperopia | 478 (100%) | 359 (75.1%) | 119 (24.9%) | - |
| Myopia | 7064 (100%) | 4728 (66.9%) | 2336 (33.1%) | - |
| Age (years) | 13.31 ± 3.50 | 12.86 ± 3.45 | 14.44 ± 3.25 | 0.000 |
| Systolic blood pressure (mmHg) | 112.32 ± 12.56 | 111.04 ± 12.13 | 115.54 ± 13.05 | 0.000 |
| Diastolic blood pressure (mmHg) | 63.16 ± 8.20 | 62.70 ± 8.16 | 64.34 ± 8.18 | 0.000 |
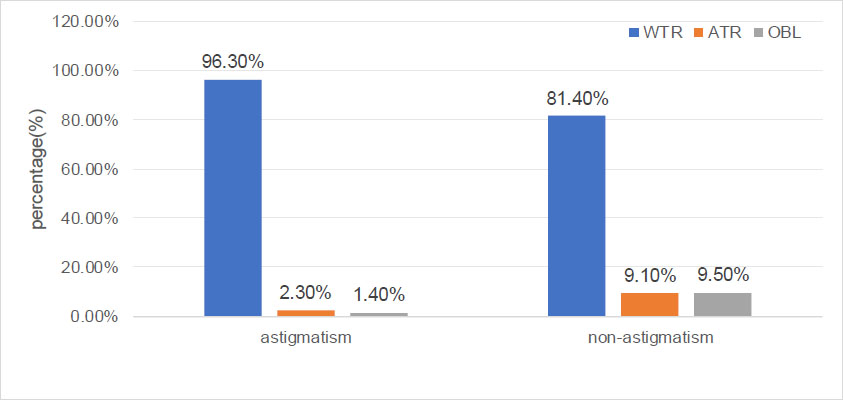
The respective percentages of WTR, ATR, and OBL in the astigmatism and non-astigmatism groups in children and adolescents.
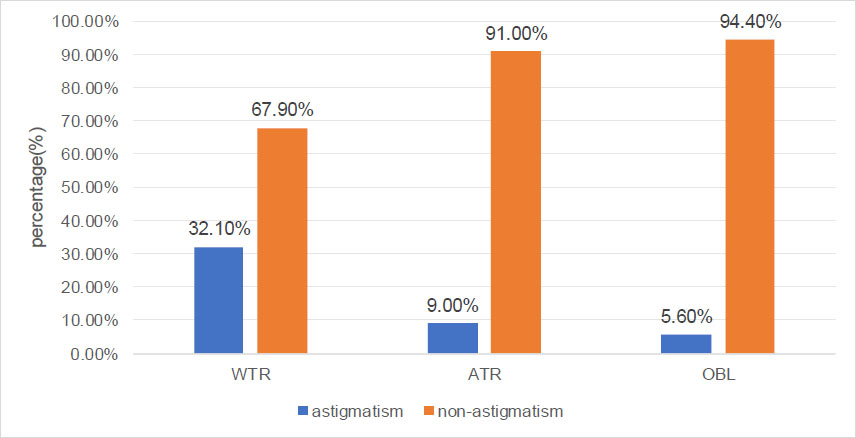
The percentages of astigmatism and non-astigmatism in different types of axial positions in children and adolescents.
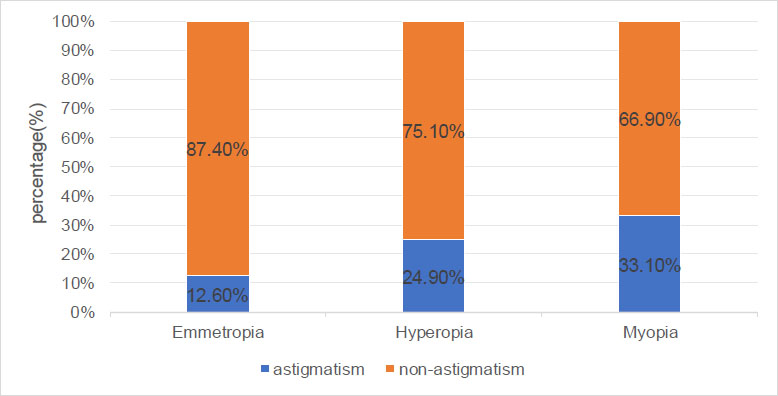
The percentages of astigmatism and non-astigmatism in different refractive states of children and adolescents.
Table 2 and Fig. (5) show that the percentages of nutritional status changing with age, overall prevalence of malnutrition, and overweight and obesity were 11.4%, 11.8%, and 11.4%, respectively. The prevalence of malnutrition and overweight tended to change with age (all, Ptrend < 0.001), and the prevalence of obesity did not tend to change with age (Ptrend = 0.113). The prevalence of astigmatism and myopia increased with age (all, Ptrend < 0.001). However, with increasing age, the prevalence of WTR, ATR, and OBL did not change (all, Ptrend > 0.05).
3.2. Association between Nutritional Status and Astigmatism
Table 3 lists the results of univariate and multiple logistic regression analyses. After adjustment for other characteristics, nutritional status, refractive state, axis position, and age were significantly associated with astigmatism (all, p < 0.001). Compared with normal nutritional status, overweight participants were 1.48 times more likely to suffer from astigmatism (aOR: 1.48, 95% CI: 1.31–1.69, p < 0.001), and obese participants were 2.01 times more likely to suffer from astigmatism (aOR: 2.01, 95% CI: 1.74–2.31, p < 0.001). Compared with participants with emmetropia, participants with hyperopia were 2.63 times more likely to suffer from astigmatism (aOR: 2.63, 95% CI: 2.03–3.40, p < 0.001), and participants with myopia were 2.43 times more likely to suffer from astigmatism (OR: 2.43, 95% CI: 2.08–2.84, p < 0.001). In addition, astigmatism was independently associated with participants with older age (aOR: 1.11, 95% CI: 1.09–1.23, p < 0.001).
| Age | N (%) | Prevalence of Malnutrition | Prevalence of Obesity | Prevalence of Overweight | Prevalence of Astigmatism | Prevalence of OBL | Prevalence of WTR | Prevalence of ATR | Prevalence of Myopia |
|---|---|---|---|---|---|---|---|---|---|
| 07–08 | 945 (10.0) | 12.6% | 12.3% | 12.0% | 16.2% | 7.9% | 81.0% | 11.1% | 30.3% |
| 09–10 | 1551 (16.4) | 15.2% | 11.5% | 12.8% | 16.0% | 7.2% | 86.1% | 6.7% | 49.6% |
| 11–12 | 1570 (16.6) | 12.6% | 11.7% | 15.4% | 24.9% | 6.2% | 87.6% | 6.2% | 72.7% |
| 13–14 | 1599 (16.9) | 11.4% | 11.1% | 15.9% | 28.4% | 6.4% | 86.1% | 7.4% | 84.4% |
| 15–16 | 1610 (17.0) | 10.1% | 11.4% | 17.3% | 34.7% | 7.0% | 86.5% | 6.5% | 91.8% |
| 17–18 | 1555 (16.4) | 6.6% | 12.5% | 19.0% | 40.7% | 8.2% | 85.5% | 6.2% | 93.0% |
| 19–20 | 628 (6.6) | 12.4% | 13.2% | 18.5% | 58.8% | 8.8% | 83.1% | 8.1% | 94.4% |
| Total | 9458 (100.0) | 11.4% | 11.8% | 11.4% | 28.5% | 7.2% | 85.6% | 7.2% | 74.7% |
| χ2(F) | - | 11.313 | 2.506 | 11.313 | 217.566 | 0.461 | 0.381 | 2.314 | 1586.111 |
| p-value | - | 0.001 | 0.113 | 0.001 | 0.000 | 0.497 | 0.537 | 0.128 | 0.000 |
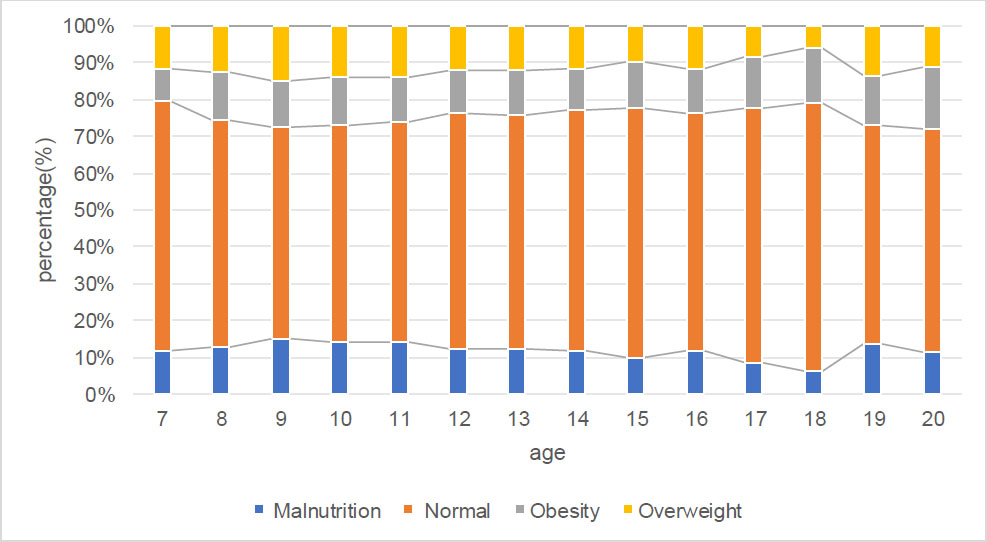
The respective percentage of different nutritional status in children and adolescents sorted by age.
| - | Univariate Analysis | Multivariate Analysis | ||||
|---|---|---|---|---|---|---|
| Characteristic | Crude OR | 95% CI | p-value | Adjusted OR | 95% CI | p-value |
| Sex | ||||||
| Male | Reference | - | - | - | - | - |
| Female | 0.79 | 0.726–0.869 | 0.000 | - | - | - |
| Refractive state | ||||||
| Emmetropia | Reference | - | - | Reference | - | - |
| Hyperopia | 2.30 | 1.799–2.951 | 0.000 | 2.629 | 2.033–3.400 | 0.000 |
| Myopia | 3.43 | 2.974–3.965 | 0.000 | 2.432 | 2.081–2.841 | 0.000 |
| Axis position, n (%) | ||||||
| OBL | Reference | - | - | Reference | - | - |
| WTR | 8.00 | 5.749–11.134 | 0.000 | 8.631 | 6.179–12.056 | 0.000 |
| ATR | 1.68 | 1.101–2.550 | 0.016 | 1.823 | 1.195–2.798 | 0.000 |
| Age | 1.143 | 1.131–1.16 | 0.000 | 1.113 | 1.096–1.130 | 0.000 |
| Nutritional status | ||||||
| Normal | Reference | - | - | Reference | - | - |
| Malnutrition | 1.294 | 1.105–1.515 | 0.001 | 0.839 | 0.707–0.982 | 0.030 |
| Overweight | 2.040 | 1.703–2.443 | 0.000 | 1.483 | 1.306–1.685 | 0.000 |
| Obesity | 2.565 | 2.124–3.098 | 0.000 | 2.009 | 1.744–2.313 | 0.000 |
| Systolic pressure | 1.03 | 1.02–1.03 | 0.000 | - | - | - |
| Diastolic pressure | 1.03 | 1.02–1.03 | 0.000 | - | - | - |
As shown in Table 4, after adjustment for other characteristics, nutritional status was not significantly associated with myopia (p > 0.05). Myopia was independently associated with participants with older age (aOR: 1.46, 95% CI: 1.429–1.484, p < 0.001) and female sex (aOR: 1.20, 95% CI: 1.077–1.33, p < 0.001).
As shown in Table 5, after adjustment for other characteristics, WTR was independently associated with the participant sex (aOR: 0.77, 95% CI: 0.688–0.869, p < 0.001), myopia (aOR: 1.19, 95% CI: 1.036–1.372, p < 0.001), overweight (aOR: 1.24, 95% CI: 1.044–1.472, p = 0.014), and obesity (aOR: 1.33, 95% CI: 1.09–1.624, p < 0.001). After adjustment for other characteristics, ATR was independently associated with participant sex (aOR: 1.334, 95% CI: 1.138–1.564, p < 0.001), myopia (aOR: 0.738, 95% CI: 0.613–0.889, p < 0.001), overweight (aOR: 0.784, 95% CI: 0.62–0.992, p = 0.043), and obesity (aOR: 0.658, 95% CI: 0.495–0.876, p = 0.004). After adjustment for other characteristics, OBL was independently associated with participant sex (aOR: 1.224, 95% CI: 1.048–1.431, p = 0.011).
| - | Univariate Analysis | Multivariate Analysis | ||||
|---|---|---|---|---|---|---|
| Characteristic | Crude OR | 95% CI | p-value | Adjusted OR | 95% CI | p-value |
| Sex | 1.06 | 0.966–1.163 | 0.221 | 1.456 | 1.429–1.484 | 0.000 |
| Age | 1.455 | 1.428–1.482 | 0.000 | 1.456 | 1.077–1.33 | 0.000 |
| BMI | 1.157 | 1.142–1.173 | 0.000 | - | - | - |
| Systolic pressure | 1.049 | 1.045–1.053 | 0.000 | - | - | - |
| Diastolic pressure | 1.059 | 1.053–1.066 | 0.000 | - | - | - |
| - | WTR | ATR | OBL | ||||||
|---|---|---|---|---|---|---|---|---|---|
| Characteristic | Adjusted OR | 95% CI | p-value | Adjusted OR | 95% CI | p-value | Adjusted OR | 95% CI | p-value |
| Sex | - | ||||||||
| Male | Reference | - | - | Reference | - | - | Reference | - | - |
| Female | 0.773 | 0.688–0.869 | 0.000 | 1.334 | 1.138–1.564 | 0.000 | 1.224 | 1.048–1.431 | 0.011 |
| Refractive state | - | ||||||||
| Emmetropia | Reference | - | - | Reference | - | - | - | - | - |
| Hyperopia | 0.782 | 0.604–1.012 | 0.062 | 1.236 | 0.885–1.727 | 0.213 | - | - | - |
| Myopia | 1.192 | 1.036–1.372 | 0.000 | 0.738 | 0.613–0.889 | 0.001 | - | - | - |
| Age | - | - | - | - | - | - | - | - | - |
| Nutritional status | - | ||||||||
| Normal | Reference | - | - | Reference | - | - | - | - | - |
| Malnutrition | 0.992 | 0.827–1.19 | 0.932 | 0.846 | 1.654–1.094 | 0.203 | - | - | - |
| Overweight | 1.24 | 1.044–1.472 | 0.014 | 0.784 | 0.62–0.992 | 0.043 | - | - | - |
| Obesity | 1.33 | 1.09–1.624 | 0.000 | 0.658 | 0.495–0.876 | 0.004 | - | - | - |
| Systolic pressure | - | - | - | - | - | - | - | - | - |
| Diastolic pressure | - | - | - | - | - | - | - | - | - |
4. DISCUSSION
The current study evaluated the relationship between nutritional status and astigmatism. Although participants in the non-astigmatism group had cylindrical values <1.0 D (and thus did not meet the clinical definition of astigmatism), their cylindrical axes were still categorized as WTR, ATR, or OBL to explore potential trends in low-magnitude astigmatic orientation. The findings of this study provide baseline data for future studies on subclinical astigmatism. Notably, the predominance of WTR orientations in both non-astigmatism and astigmatism groups aligns with age-related eyelid tension trends [7], suggesting that even subclinical astigmatism may reflect biomechanical influences. We found that astigmatism was related to factors, such as nutritional status, refractive status, axial position of the cylindrical mirror, and age. When compared with normal nutritional status, participants with obesity were 2.01 times more likely to suffer from astigmatism. Meanwhile, we found that myopia was not related to nutritional status. In children and adolescents, the prevalence of various types of axis positions does not change with age.
Obesity and overweight are major worldwide concerns, with approximately 30% of school-age children and adolescents severely affected by a high BMI [31, 32]. It is estimated that 192 million children and adolescents worldwide were moderately or severely underweight in 2016. At the same time, 124 million children and adolescents were obese worldwide. Over the past 30 years, the worldwide prevalence of overweight and obesity among children and adolescents aged 5–19 years has been increasing [33]. Obesity in childhood and adolescence is closely related to type 2 diabetes, respiratory diseases, and psychological and social problems and has major effects during adulthood [34-37]. Therefore, attention to the nutritional status of children and adolescents and preventing them from being overweight and obese is currently a major global priority. In 2019, the overweight percentages of Chinese children and adolescents for males or females were 15.44% and 13.34%, while the obesity percentages were 18.41% and 10.23%, respectively [12]. In the current study, the overweight percentages of male or female children and adolescents in eastern China were 12.2% and 10.5%, and the obesity percentages were 15.3% and 7.9%, respectively. It can be seen that the rapid weight gain of children and adolescents in recent years has been controlled, which may be closely related to a series of important sports policies and regulations issued by government agencies [38]. However, current research reported that obesity is still the most common type of abnormal nutritional status among children and adolescents in eastern China, so it requires further management.
At present, the exact cause of astigmatism is still unclear. The cornea contributes about two-thirds of the total optical power of the eye, and the anterior surface curvature of the cornea is mainly responsible for the corneal refractive power. Previous results have suggested that pathological changes in eyelids led to changes in the shape of the corneal anterior surface, resulting in an increase in the prevalence of astigmatism [5, 9]. Blepharoptosis has been confirmed to be associated with astigmatism [6]. Zhuo et al. conducted an epidemiological study on preschool children aged 3–6 years in China and found that in 9.68% of children with astigmatism ≥1.5 D, 51.14% of them had epiblepharon [17, 18]. Approximately 50% of children with chalazion in the middle-upper eyelids suffer from astigmatism [39]. In children with Down’s syndrome, the prevalence of upward eyelid tilt ranges from 82–100%, the prevalence of eyelid crease ranges from 61–100%, and the prevalence of astigmatism is approximately 60% [40, 41]. The changes in the degree of astigmatism after eyelid surgery also confirmed the influence of eyelids on astigmatism [42, 43]. The eyelid condition of obese children and adolescents is also abnormal. Obese children and adolescents have shallow orbits and prominent periorbital fat in the eyelids, which may lead to greater pressure on the cornea from the eyelids [5, 44]. These assumptions can explain why obese individuals tend to show a shift to higher astigmatism with voluminous and fatty eyelids. In addition to the eyelids and orbits, the effects of obesity on extraocular muscles may also lead to an increased prevalence of astigmatism [45]. The present study suggested that the prevalence of astigmatism in children and adolescents with normal nutritional status was 25.7%, while the prevalence of astigmatism in obese children and adolescents was as high as 40.7%. Considering that in the current research, the prevalence of obesity in children and adolescents was 11.8%, the threat of astigmatism cannot be underestimated. In a study by Kim et al., it was reported that high BMI was an independent risk factor for astigmatism in adults [6]. The present study suggested that this relationship also existed in children and adolescents, and compared with normal nutritional status, participants with obesity were 2.01 times more likely to suffer from astigmatism, and overweight participants were 1.48 times more likely to suffer from astigmatism.
Corneal astigmatism is believed to be induced by pressure on the eyelids on the cornea, which causes a vertical meridian, resulting in regular astigmatism [5, 7]. The current research supported this hypothesis. The current research reported that the prevalence of astigmatism in children and adolescents with WTR was 8.6 times that of patients with OBL. Although the prevalence of astigmatism in patients with ATR was 1.8 times that of children and adolescents with OBL, it was clear that astigmatism was most closely related to WTR in children and adolescents. The degree and axial position of cylindrical lenses constantly change with development and aging. There is a high degree of corneal astigmatism in infants [46]. From infancy to childhood, as infants grow and develop, the tightness of the eyelid may affect the refractive power, with the cornea flattening with significantly reduced astigmatism [46]. The pressure from the eyelids on the cornea may then cause a cylindrical axis shift from ATR to WTR [47]. In childhood and early adulthood, astigmatism is predominantly WTR in the axis. With aging, the thickness of the orbicularis oculi muscle decreases, with eyelid laxity [48]. Loss of elasticity in the connective tissue of the eyelid may also contribute to a less compressive effect on the globe during adulthood. These factors inevitably cause changes in the pressure on the cornea. The cylindrical axis generally changes from a predominance of WTR to a predominance of ATR [27]. In the current study, it was found that in children and adolescents, the most common type of cylindrical lens was the WTR, accounting for 85.6%, which is consistent with most previous studies [49, 50]. Current research also showed that, unlike in infancy and adulthood, the prevalence of different types of axial positions did not change with age in children and adolescents. In children and adolescents, males with myopia, overweight, or obesity were more likely to present WTR of axis position.
There is still controversy over whether nutritional status is an independent risk factor for myopia. Some studies have suggested that an increase in BMI was associated with an increase in myopia [11, 51, 52], while others have reported that an increase in BMI was associated with a decrease in myopia [53, 54]. In the present study, the relationship between nutritional status and myopia showed a tendency for positive changes as the BMI increased when using univariate analysis, but in multivariate analysis after adjusting for factors, such as sex and age, no correlation was found between nutritional status and myopia (Table 4). The current research results were similar to some previous studies [10, 54, 55]. Furthermore, the SE used in the diagnosis of myopia was the spherical lens power plus one-half of the cylindrical lens power. The current study has identified the relationship between nutritional status and astigmatism, which makes the relationship between nutritional status and myopia even more confusing. When studying the potential relationship between nutritional status and myopia, the use of SE for the diagnosis of myopia may not be accurate. In such studies, indicators for the diagnosis of myopia in children and adolescents should be based on the axial length of the eye when considering factors, such as age, sex, and ethnicity.
As the research subjects were mainly children and adolescents in the current study, a more accurate classification of nutritional status based on age, sex, height, and BMI was conducted, and the relationships between nutritional status and astigmatism, especially obesity and astigmatism, were analyzed in detail. The advantages of this study included a large sample size and a wide age range of students from primary school to high school. Nevertheless, there were a few limitations in this study. First, this was a cross-sectional study, making it difficult to accurately identify causality. Second, this study did not include corneal topography; thus, the contribution of corneal astigmatism to total astigmatism and its potential interaction with nutritional status could not be analyzed. Future studies incorporating corneal biomechanical measurements are warranted. Last, this study did not involve ophthalmic tests, including factors characterizing myopia other than the degree of refraction. In addition, the refractive error in this study was measured without cycloplegia, which may have resulted in an overestimation of the prevalence of myopia. However, the effect of cycloplegia on astigmatism was not as significant as that of myopia. Furthermore, the study of children and adolescents found no statistically significant difference in astigmatic axes and cylindrical refractive power measured before and after cycloplegia [23].
CONCLUSION
This study identified a significant association between obesity and astigmatism in Chinese school-aged children, with obese participants facing twice the risk of astigmatism compared to their normal-weight peers. These findings underscore the importance of maintaining healthy nutritional status in pediatric populations to mitigate refractive errors. Mechanistically, obesity-related periorbital fat accumulation may increase eyelid tension, altering corneal curvature, a hypothesis supported by the predominance of with-the-rule astigmatism in this cohort.
While our cross-sectional design precludes causal inference, the large sample size and standardized protocols strengthen the validity of these associations. Future studies should incorporate longitudinal designs, corneal topography, and biomechanical measurements to unravel obesity’s ocular effects. Public health initiatives targeting childhood obesity may concurrently reduce the burden of visual impairment, highlighting the need for integrated strategies.
AUTHORS’ CONTRIBUTIONS
The authors confirm their contribution to the paper as follows: X.C.: Methodology; Y.Z., Y.X., and Y.G.: Data collection; L.L.: Validation; X.H.: Data analysis or interpretation; Y.W. and Z.S.: Writing, reviewing, and editing; Y,Z,: Writing the original draft preparation; M.W.: Writing the paper. All authors reviewed the results and approved the final version of the manuscript.
LIST OF ABBREVIATIONS
| NSES | = Nantong School-aged Children Eye Study |
| BCVA | = The Best-corrected Visual Acuity |
| BMI | = Body Mass Index |
| NSES | = Nantong School-aged Children Eye Study |
| OBL | = Oblique |
| OR | = Odds Ratio |
| CI | = Confidence Interval |
ETHICS APPROVAL AND CONSENT TO PARTICIPATE
The study was approved by the Human Research Ethics Committee of the Second Affiliated Hospital of Nantong University, China (no. 2023KT122).
HUMAN AND ANIMAL RIGHTS
All procedures performed in studies involving human participants were in accordance with the ethical standards of institutional and/or research committee and with the 1975 Declaration of Helsinki, as revised in 2013.
CONSENT FOR PUBLICATION
Informed consent in written form was obtained from all participants and the participants’ guardians for those under 18 years of age.
AVAILABILITY OF DATA AND MATERIALS
The data supporting the findings of the article will be available from the corresponding author [Z.M.S] upon reasonable request.
FUNDING
This work was supported by funds from the Nantong Science and Technology Bureau (No. MSZ2023103), the Scientific Research Project of Nantong Health Committee (No. MS2023029 and No. QNZ2023033), and the Nantong Science and Technology Program, China (project No. MS2020035).
ACKNOWLEDGEMENTS
Declared none.